Real-time tweets with Tweepy and Cartopy
In 2015 I wrote a post about Display real-time tweets on a map with Basemap and Tweepy, but since Basemap is considered as deprecated, I decided to update the post using Cartopy instead of Basemap.
Let's create first a simple project displaying the tweets around the world, then a second example focusing on a specific location.
Code on Github
Complete code available on my Github :

Previous posts about Tweepy
 Michael Caraccio
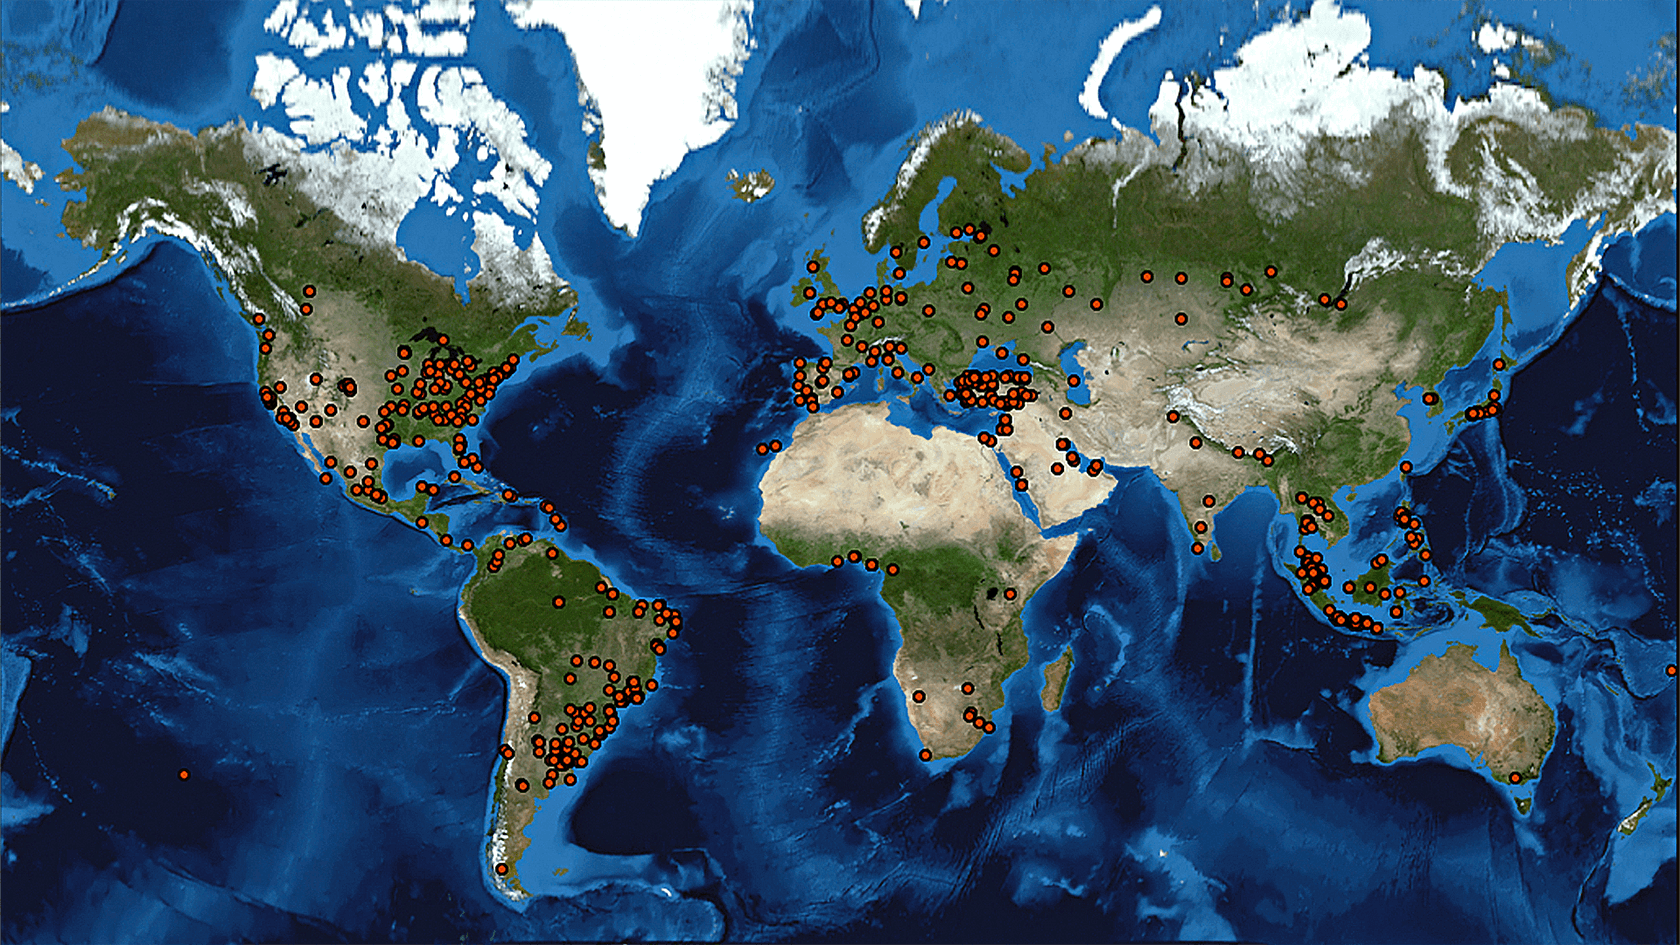 Michael Caraccio
Install Cartopy
with conda
Activate your environment :
# For Linux and macOS
source activate YOUR_ENV
# For Windows
activate YOUR_ENV
Install Cartopy package :
conda install -c conda-forge cartopy

# for a specific version
conda install -c conda-forge cartopy"==0.17.0"
or from source
# clone repository
git clone https://github.com/SciTools/cartopy.git

# install cartopy
python setup.py install
You can check your Cartopy version from the terminal with :
# start python
python

# import Cartopy
import cartopy

# check installed version
cartopy.__version__
return -> '0.17.0'
Authentication and get tweets with Tweepy
Authentication and the main program are split in two files :
authentication.py and tweepy_cartopy_worldwide.py
The following code didn't change since my last post. If you need more information about it, you can take a look at my previous post :
Michael Caraccioauthentication.py
class authentication:
    def __init__(self):
        # Go to http://apps.twitter.com and create an app.
        # The consumer key and secret will be generated for you after
        self.consumer_key = "xxxx"
        self.consumer_secret = "xxxx"

        # Create an access token
        self.access_token = "xxxx"
        self.access_token_secret = "xxxx"

    def getconsumer_key(self):
        return self.consumer_key

    def getconsumer_secret(self):
        return self.consumer_secret

    def getaccess_token(self):
        return self.access_token

    def getaccess_token_secret(self):
        return self.access_token_secret
tweepy_cartopy_worldwide.py
import matplotlib.pyplot as plt
import tweepy

# Consumer and access token/key
from authentication import authentication

# Tweepy listener
class TwitterStreamListener(tweepy.StreamListener):
    """ A listener handles tweets are the received from the stream.
    This is a basic listener that just prints received tweets to stdout.
    """

    # Get the new tweet, and give it to the get_tweet() method
    def on_status(self, status):
        self.get_tweet(status)

    # If there's an error, this method will be called. You can manage the different error code here. Here only 403 is handled
    def on_error(self, status_code):
        if status_code == 403:
            print("The request is understood, but it has been refused or access is not allowed. Limit is maybe reached")
            return False

    @staticmethod
    def get_tweet(tweet):
        # we only care about tweets with coordinates
        if tweet.coordinates is not None:
            print(tweet) # debug purpose

            # Get coordinates from the current tweet
            x, y = tweet.coordinates['coordinates']  # get coordinates from the tweet

            # -------------------------------------------------------
            # MISSING CODE #2 : See below - Display tweets on the map
            # -------------------------------------------------------


if __name__ == '__main__':

    # Get access and key from authentication class
    auth = authentication()

    consumer_key = auth.getconsumer_key()
    consumer_secret = auth.getconsumer_secret()

    access_token = auth.getaccess_token()
    access_token_secret = auth.getaccess_token_secret()

    # Authentication
    auth = tweepy.OAuthHandler(consumer_key, consumer_secret)
    auth.secure = True
    auth.set_access_token(access_token, access_token_secret)

    api = tweepy.API(auth, # credentials
                     wait_on_rate_limit=True, # Wait if limit is reached
                     wait_on_rate_limit_notify=True, # Notify is limit is reached
                     retry_count=10, # retry counter when error occurs
                     retry_delay=5, # seconds between each try
                     retry_errors={401, 404, 500, 503} #  which HTTP status codes to retry
                     )

    # create our listener
    streamListener = TwitterStreamListener()

    # get the twitter stream
    myStream = tweepy.Stream(auth=api.auth,
                             listener=streamListener # our listener above
                             )

    # get tweets from everywhere
    earth_location_coord = [-180, -90, 180, 90]

    # filter by location
    myStream.filter(locations=earth_location_coord)

    # -------------------------------------------------------
    # MISSING CODE #1 : See below - Create the map
    # -------------------------------------------------------
Display tweets on a map
Now let's complete the code above by replacing the "MISSING CODE #" with the following code.
MISSING CODE #1 - Create the map
# Size of the map
fig = plt.figure(figsize=(9, 5), dpi=150)

# Set a title
plt.title("Tweet's around the world")

# Declare map projection
ax = plt.axes(projection=ccrs.PlateCarree())

# Put a background image on for nice sea rendering
ax.stock_img()
MISSING CODE #2 - Display tweets
@staticmethod
def get_tweet(tweet):
    # we only care about tweets with coordinates
    if tweet.coordinates is not None:
        x, y = tweet.coordinates['coordinates']  # get coordinates from the tweet
        plt.plot(x, y, 'ro', markersize=2)  # plot the red dot on the map
        plt.pause(0.01)  # little trick to update the map
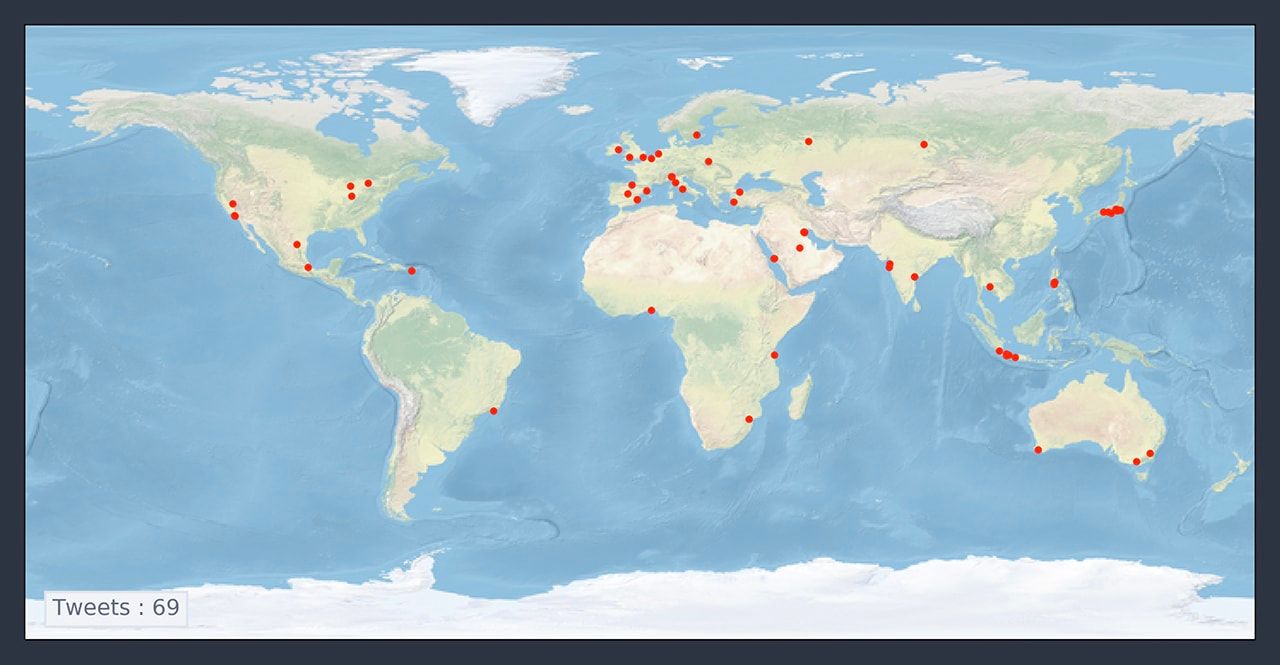
Display a counter on the plot
On the bottom left corner of the picture above, you can see a little counter. Basically we need to define a counter, display it on the plot, then when there's a new tweet we update the text.
Let's see how to implement it :
Inside the TwitterStreamListener, we add the following constructor :
def __init__(self):
    super().__init__()
    self.tweet_counter = 0                 # counter
    self.text_position = self.get_axis_limits(ax) # set x,y text position
    self.tweet_counter_text = ax.text(
            self.text_position[0],         # x position
            self.text_position[1],         # y position
            "Tweets : " + str(self.tweet_counter), # text
            fontsize=9,                    # fontsize
            ha="center", va="center",      # position of text in the box
            color=(0.30, 0.34, 0.42),      # textcolor
            bbox=dict(                     # fancybox
                boxstyle="square,pad=0.3", # square with padding
                ec=(0.85, 0.87, 0.91),     # inner color
                fc=(0.93, 0.94, 0.96)      # border color
            ))

# return x and y position. You can define your own scale for x and y axis
@staticmethod
def get_axis_limits(axes, scale_x=0.85, scale_y=0.9):
    return axes.get_xlim()[0] * scale_x, (axes.get_ylim()[0] * scale_y)
Complete code
Download the complete code on Github
Map Style and tweet from a specific location
Image Tiles
Cartopy can download tiles from many others sources (OSM, MapBox, Google, etc).
Map Projection
On my previous example I use a specific map projection, which is Plate Carré. But different map projections are available here.
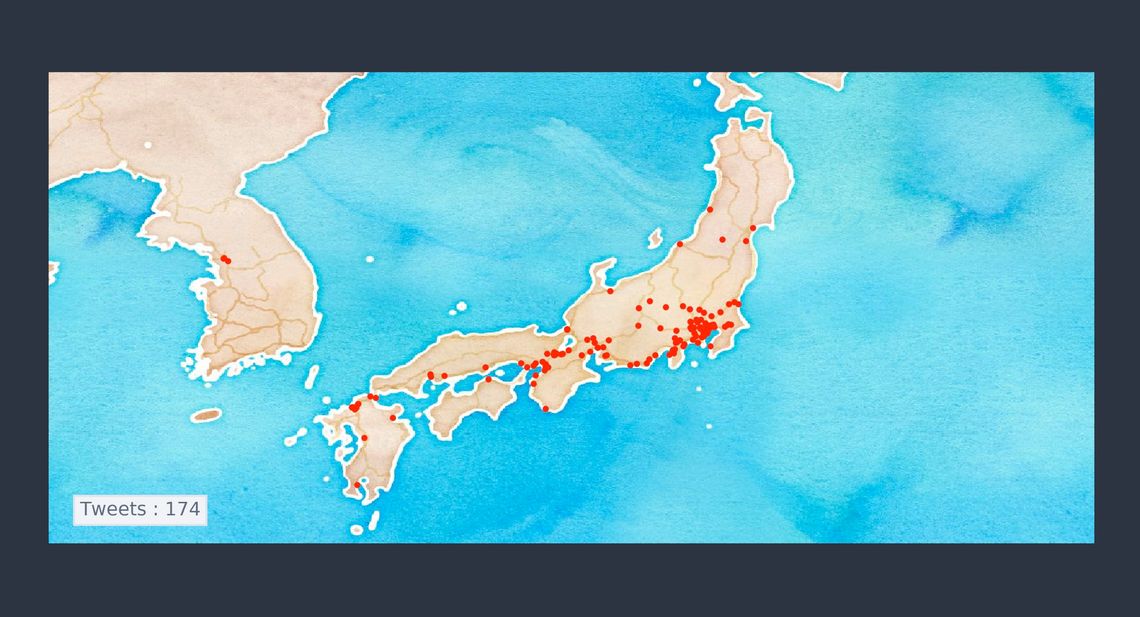
Example - Tweets from Japan and Stamen map tiles
Map code
# Japan coordinates
japan_extent = [122.372118838, 150.0007330301, 29.9785169793, 42.4539733251]

# Create a Stamen watercolor background instance
stamen_terrain = cimgt.Stamen('watercolor')

# Define map size and dpi
fig = plt.figure(figsize=(9, 5), dpi=150)

# Create a PlateCarree in the tile's projection
ax = plt.axes(projection=ccrs.PlateCarree())

# Limit the extent of the map to a small longitude/latitude range
ax.set_extent(japan_extent, crs=ccrs.PlateCarree())

# Add the Stamen data at zoom level 6.
ax.add_image(stamen_terrain, 6)
Set the filter for Japan
japan_location_coord = [122.372118838, 29.9785169793, 150.0007330301, 42.4539733251]

myStream.filter(locations=japan_location_coord)
Take a look at Stamen Maps

Cartopy

Tweepy

Member discussion